Clarity: UX made simple & free
Clarity was launched by Microsoft at the end of 2020. I’ve only just begun to use it, so I’m not in a position to give it a ringing endorsement, but I’m very impressed with how pleasant it is to use.
A great example of the Keep it Simple, Stupid principle and a useful tool for those wanting to move to a more agile data-driven approach focussed on UX
What Clarity does
It comes with:
- Session recordings (to see what individual visitors do)
- Heat maps
- Quick insights and
- Basic analytics
In some ways it combines tools like Google Analytics and Hotjar, but it is not really attempting to compete with these. In fact, it has integration with Google Analytics.
It’s entirely free without limitations and used by the likes of the World Health Organization, Forbes and Pizza Hut
There is a feather-light WordPress plugin for it, but it’s easy to manually add the script to your site head code area.
I have tested almost 30 sites and have not seen a drop off in page loads with Google’s PageSpeed Insights. It’s always worth checking for any JavaScript issue, but I’ve seen no issues with my Ecommerce sites
It is GDPR & CCPA ready. The data is anonymised and you can also filter options on what content is recorded. By default it anonymizes what a user enters in a site form. It does drop a cookie. There is a little more work to do if you have to get consent first.
Personally, I don’t worry about the cookie law. It’s not tracking personal data so unless the client requires more I list it on privacy and cookie pages along with Google Analytics.
Key Clarity metrics
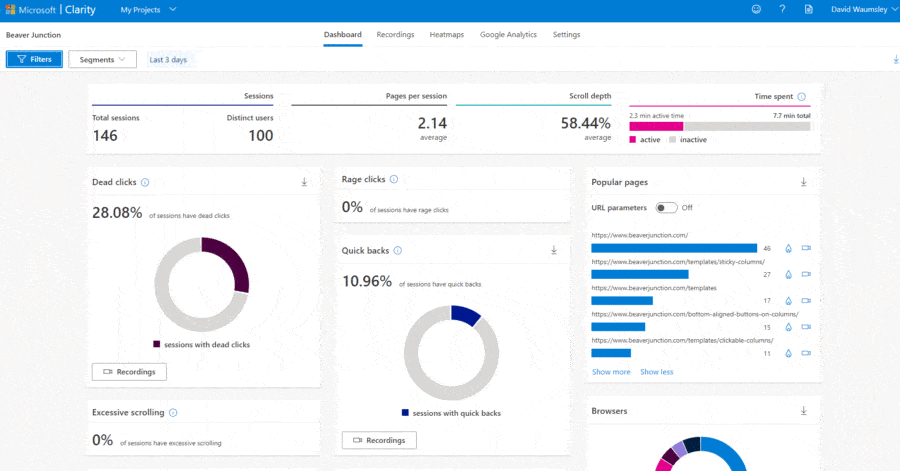
- Dead clicks – Finds those areas that look confusingly clickable.
- Rage clicks – Finds when something is not responding to clicks.
- Quick back – Indicate someone has gone to page that were not what they expected and returned
JavaScript errors. - Excessive scrolling – Implying the information is not easy to find.
- Basic visitors stats – by device, country, browser, popular pages and on ecommerce popular product.
What I like most is you can click on any section of a pie chart for the above and get the relevant live recordings.
I have noticed that most sites have dead clicks due to people copying and pasting and anything that triggers a JS action like a mobile menu from a Hamburger button.
Also you get JavaScript errors due to Clarity not loading things like embedded Google maps.
What I like about Clarity
In the past I have tried some tools to monitor UX like Crazy egg, Hotjar and less known Cux.
All are great and If I was going to do some serious UX work for clients they may be better, but Clarity is something I would add to all sites.
As I am keen to get out a Minimal Viable Website, this is a great way to get some early feedback for the rest of the build.
Also I may use it to:
- Record client using my page builder (Beaver Builder) as part of training. It will show the backend UI (before excluded their IP address).
- Record live UI testing done via a screen-share and chat session (Zoom, Whereby or Skype).
Knowing I have this means I can easily share a recording with client if there was some dispute over whether visitors would:
- Use a slider or carousel.
- Need a home link in the menu.
- Need certain content above the fold.
There is the ability to make a recording public to those with the complex URL for a limited number of days so they don’t need an account.
If they want to see it all you can make them a team member or an admin (should you want to hand it all over to them).
Additionally, there is a Chrome extension.
The integration between Clarity and Google Analytics
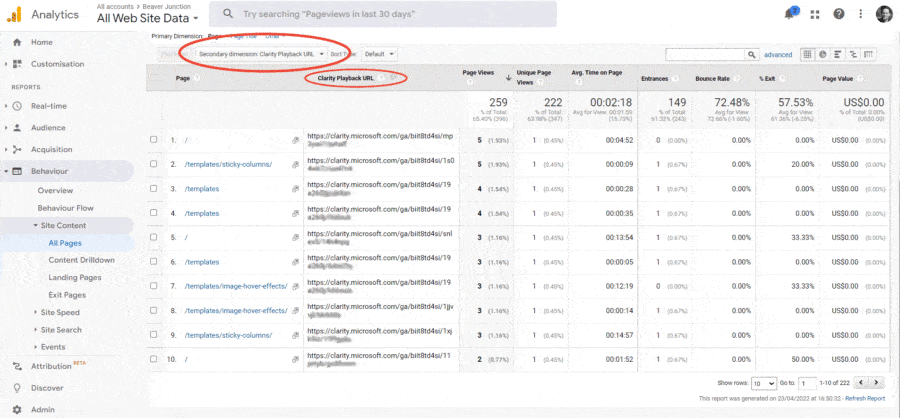
In most cases it is easy to set up a connection with Google Analytics. You give permission and select your account from a drop down menu.
If not showing you need to follow the instructions to set up your own “dimension” for Clarity. When selected in Google Analytics you can see the Clarity recording associated with a visit.


